

What the Inverted Yield Curve Says About Inflation, the Fed and the Market Recovery
Author: James Liu, CFA. Founder and Head of Research, Clearnomics
The market recovery has hit a bump due to uncertainty around interest rates and the Fed. Rates have driven markets all year with significant impacts on stock and bond prices, economic growth, the housing market, and more. In an environment like this, market expectations matter just as much, if not more, as the actual numbers, and this is reflected in the yield curve. Today, the yield curve is not just inverted, but is unusually shaped compared to recent history due to the Fed's battle with inflation and the slowing economy. For long-term investors, what does the yield curve suggest about economic growth and Fed policy in the years ahead?
Although the yield curve is a technical concept, the basic idea is simple. A yield curve is just a graph that shows the level of interest rates at different time horizons, or maturities. This tells you what interest rate you would earn if you invested in a new bill, note or bond for that duration, be it 3 months or 30 years. When investors talk about the yield curve, they are typically referring to one based on government-issued U.S. Treasuries since these are considered to be the safest fixed income securities.
The yield curve is inverted
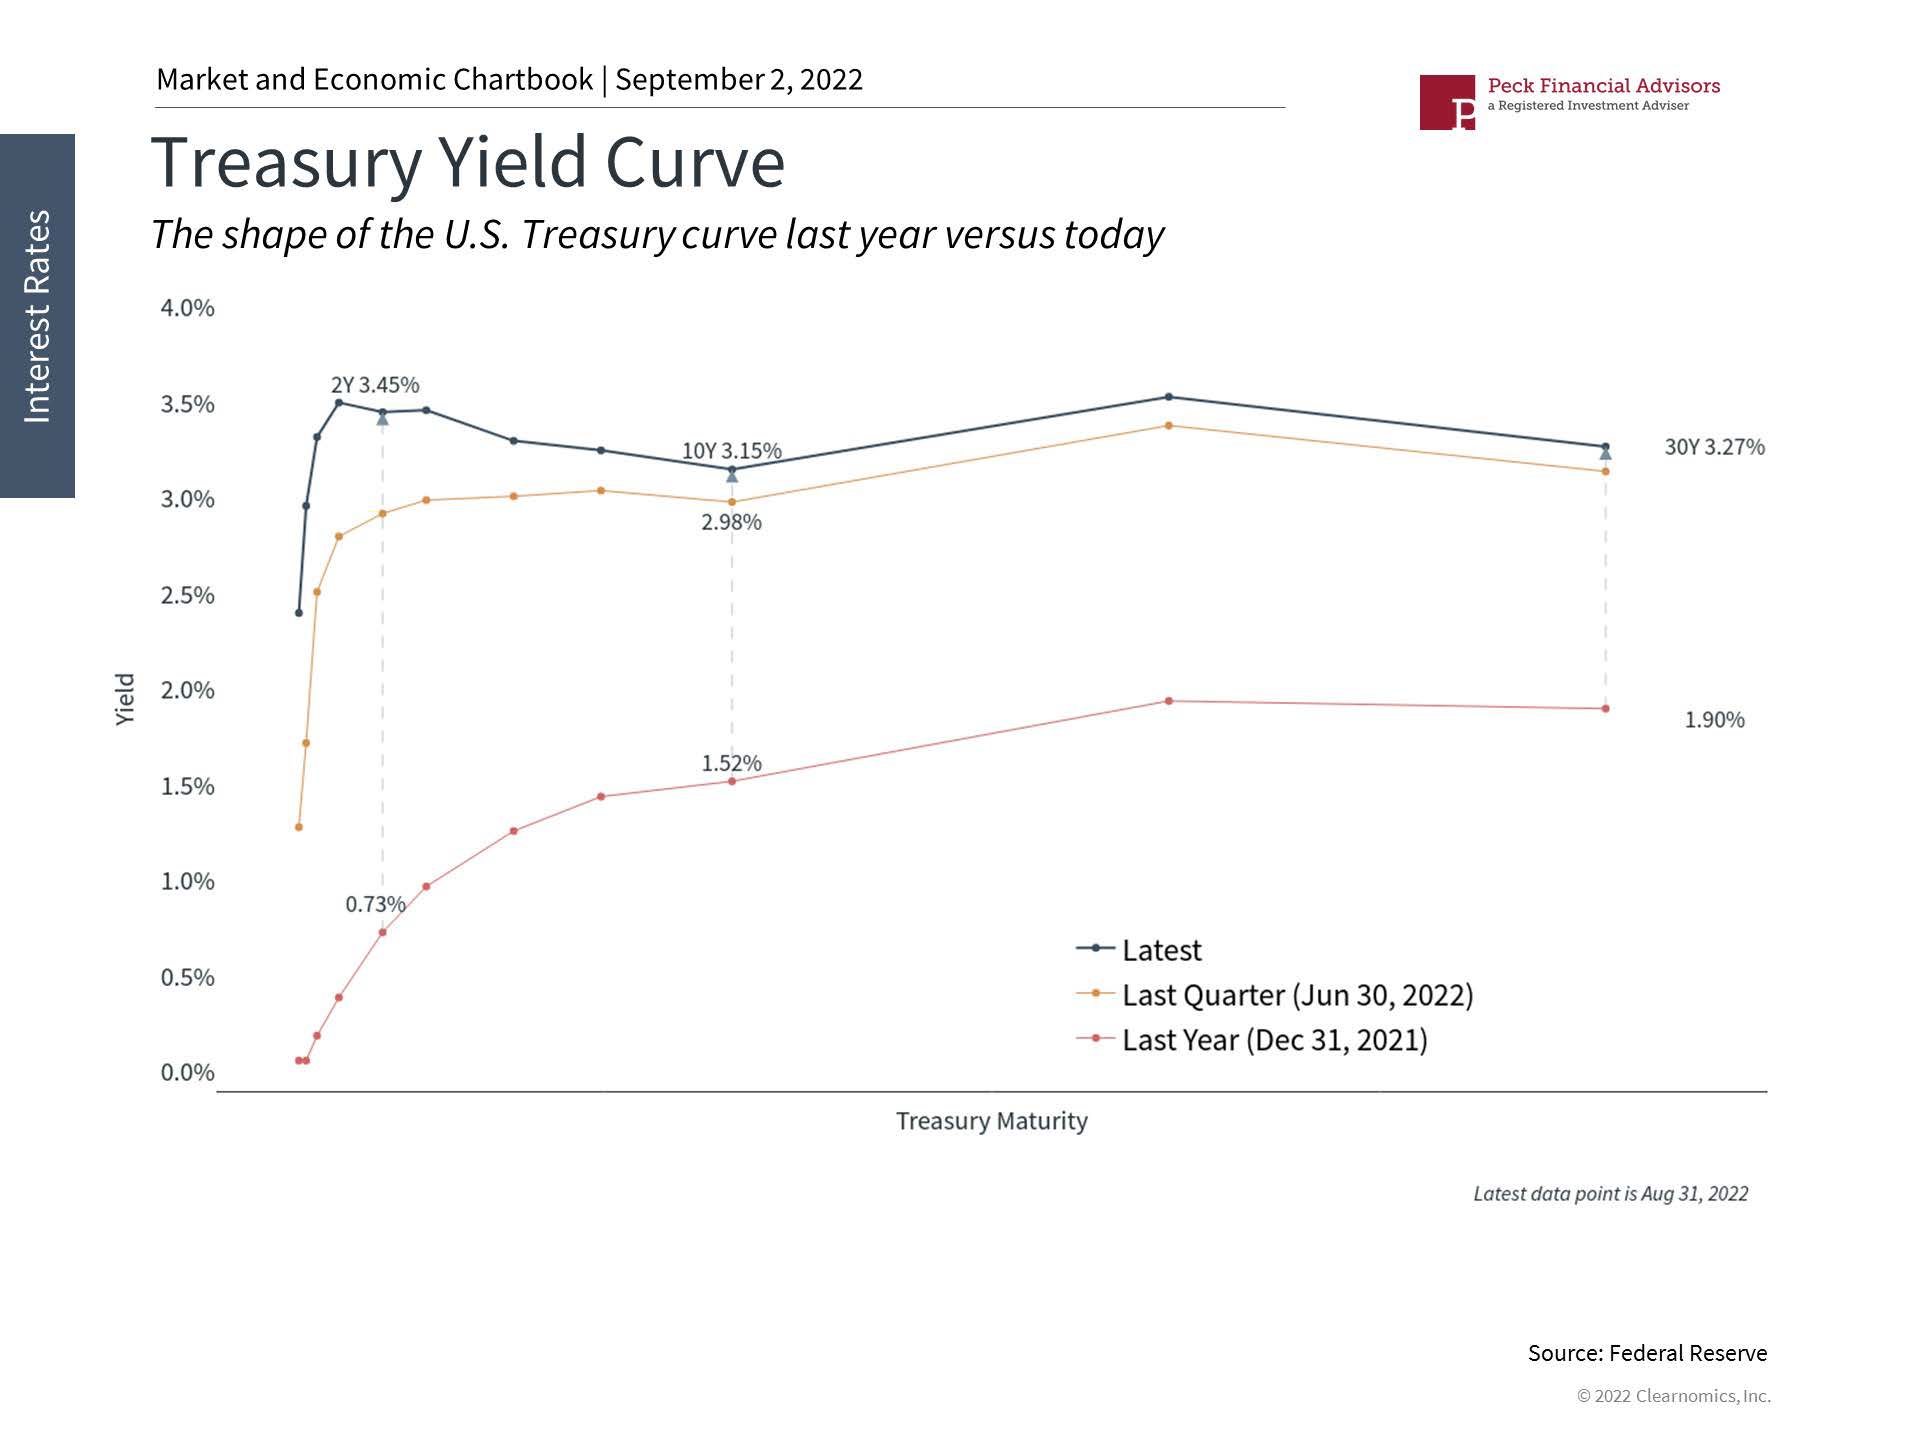
Traditionally, economists and market professionals look at the difference between 10-year and 2-year Treasury yields. When the difference is positive, we say that the yield curve is "steep" (it slopes upward to the right, as it did a year ago). When the difference is small, we say that the yield curve is "flat." When the difference is negative, i.e. 2-year yields are above 10-year yields, the curve is inverted (it slopes downward to the right), as it is today.
This is related to the economy because the yield curve tends to flatten as lower growth expectations push down long-term interest rates. Eventually, long-term rates may fall below short-term rates, which are often still high because of Fed policy, thus causing the yield curve to invert. In contrast, when the economy is expanding or coming out of a recession, the yield curve typically has a positive slope and investors are rewarded with higher yields for holding longer-term bonds. If future growth expectations are high, interest rates are expected to follow a rising path, and the yield curve steepens.
The Fed has reiterated its plan to fight inflation with higher rates
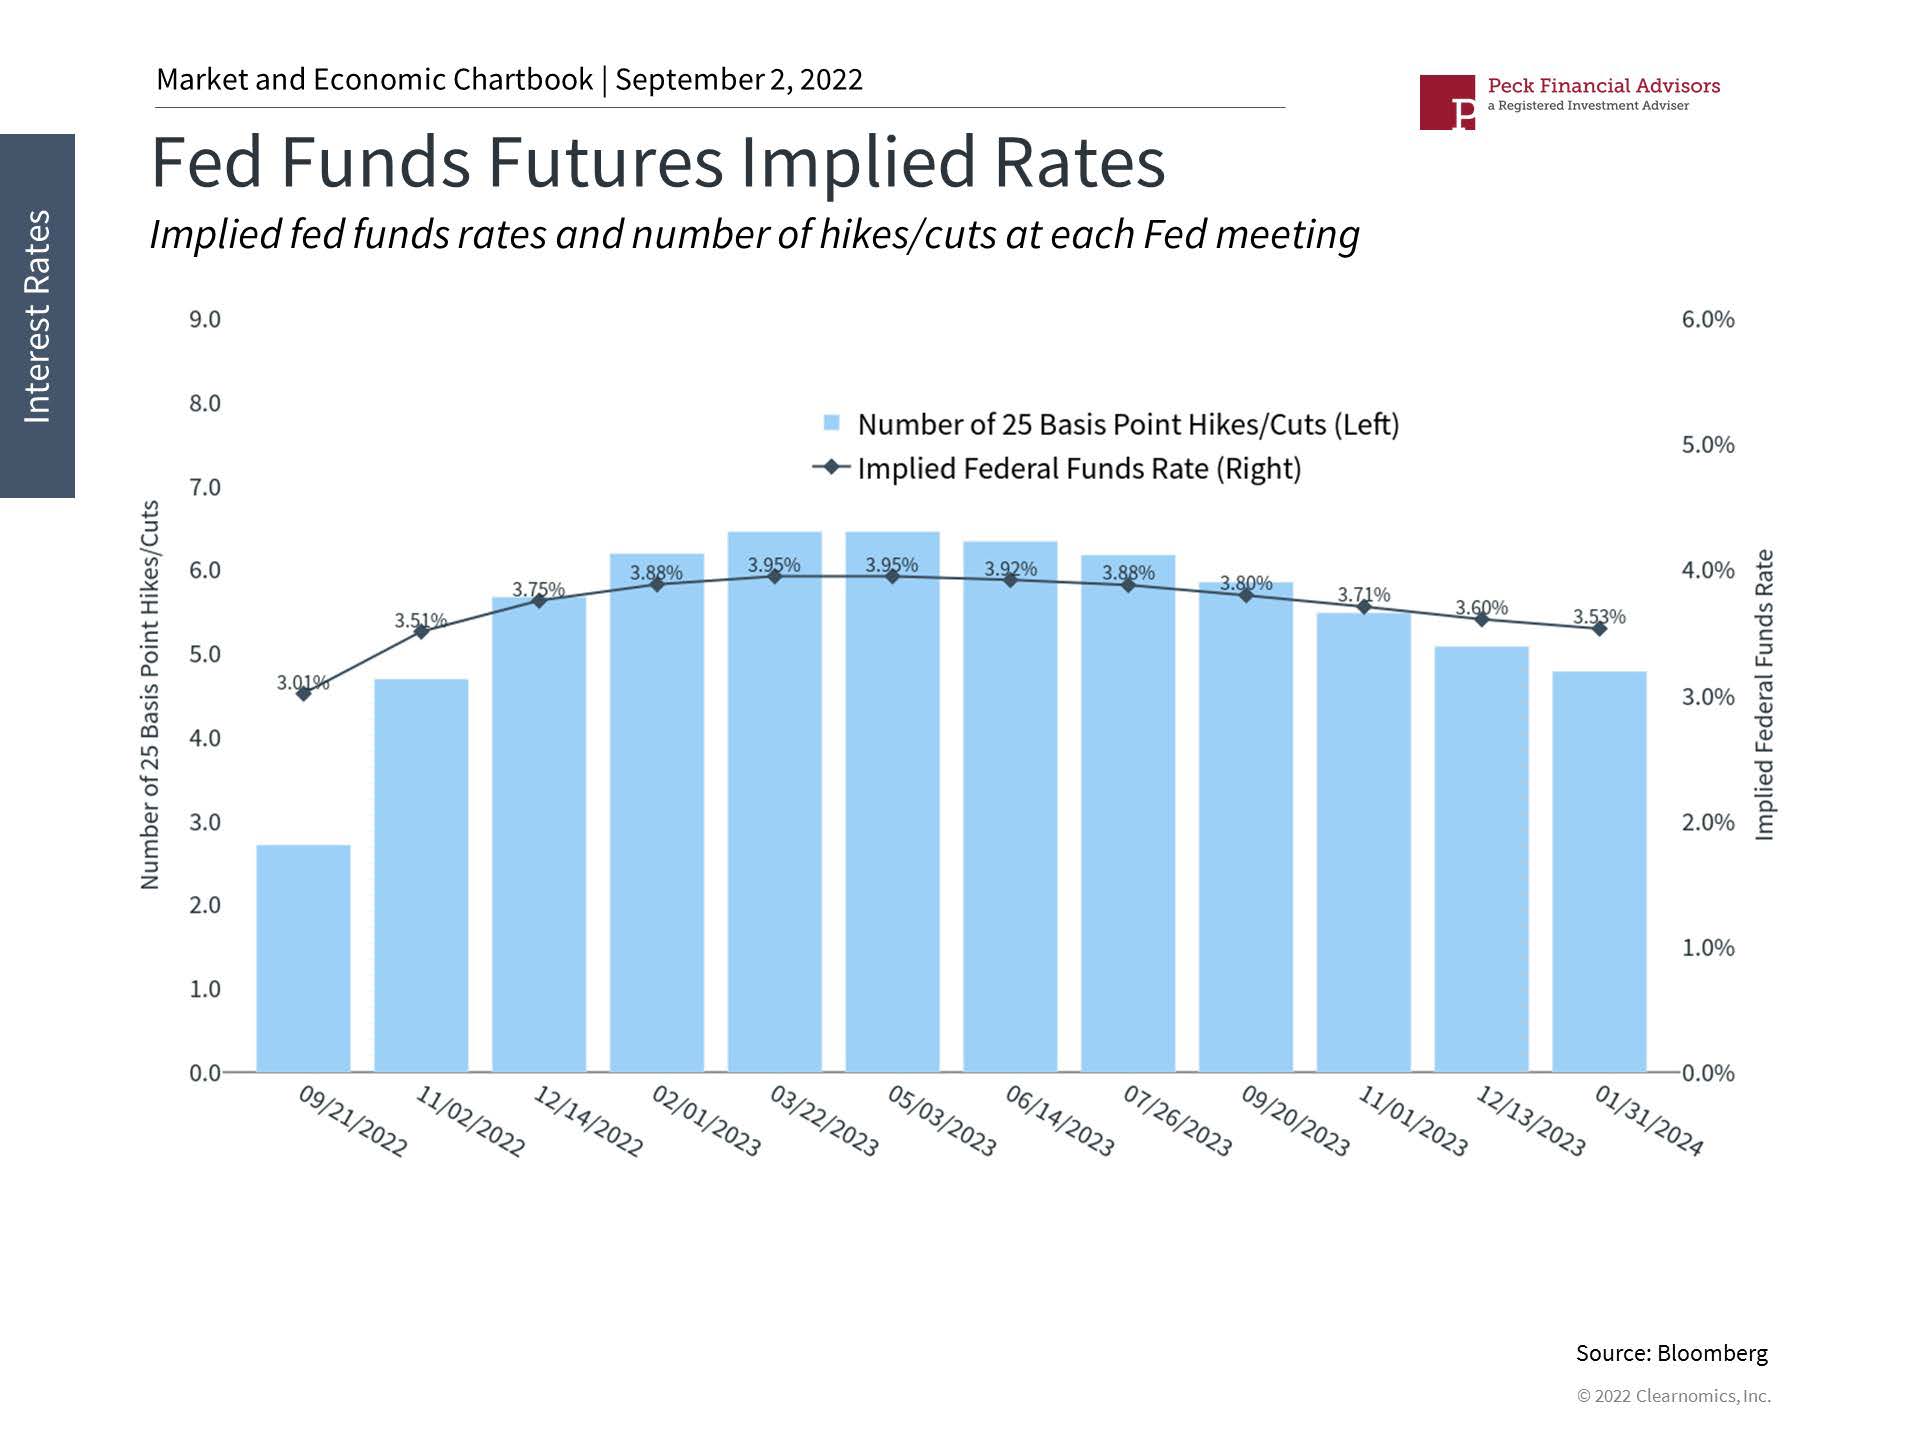
The yield curve has already inverted twice this year as the 2-year Treasury yield surpassed the 10-year yield in March and again in July due to the economic slowdown. Today's unusual curve represents the fact that the Fed will need to keep short-term rates high in order to combat inflation, even as long-term growth expectations fall. As the chart above shows, the market expects the Fed to increase policy rates to about 3.75% by early next year, up from a target range of 2.25% to 2.50% today, before allowing rates to moderate.
Thus, the key to understanding this dynamic is that they reflect market expectations today. In other words, investors already know that inflation is high, the economy is decelerating somewhat, and that the Fed is accelerating its rate hikes in order to prevent further price increases. What remains uncertain is how quickly inflation might come down and how long the Fed will keep raising rates. This is one reason markets pulled back last week when Fed Chair Jerome Powell, in his speech at Jackson Hole, reiterated the Federal Reserve’s dedication to fighting inflation with rates that could remain higher for longer. In the Fed's view, it is important to fight inflation today to prevent persistent price increases even if it risks slowing the economy further.
The housing market has softened
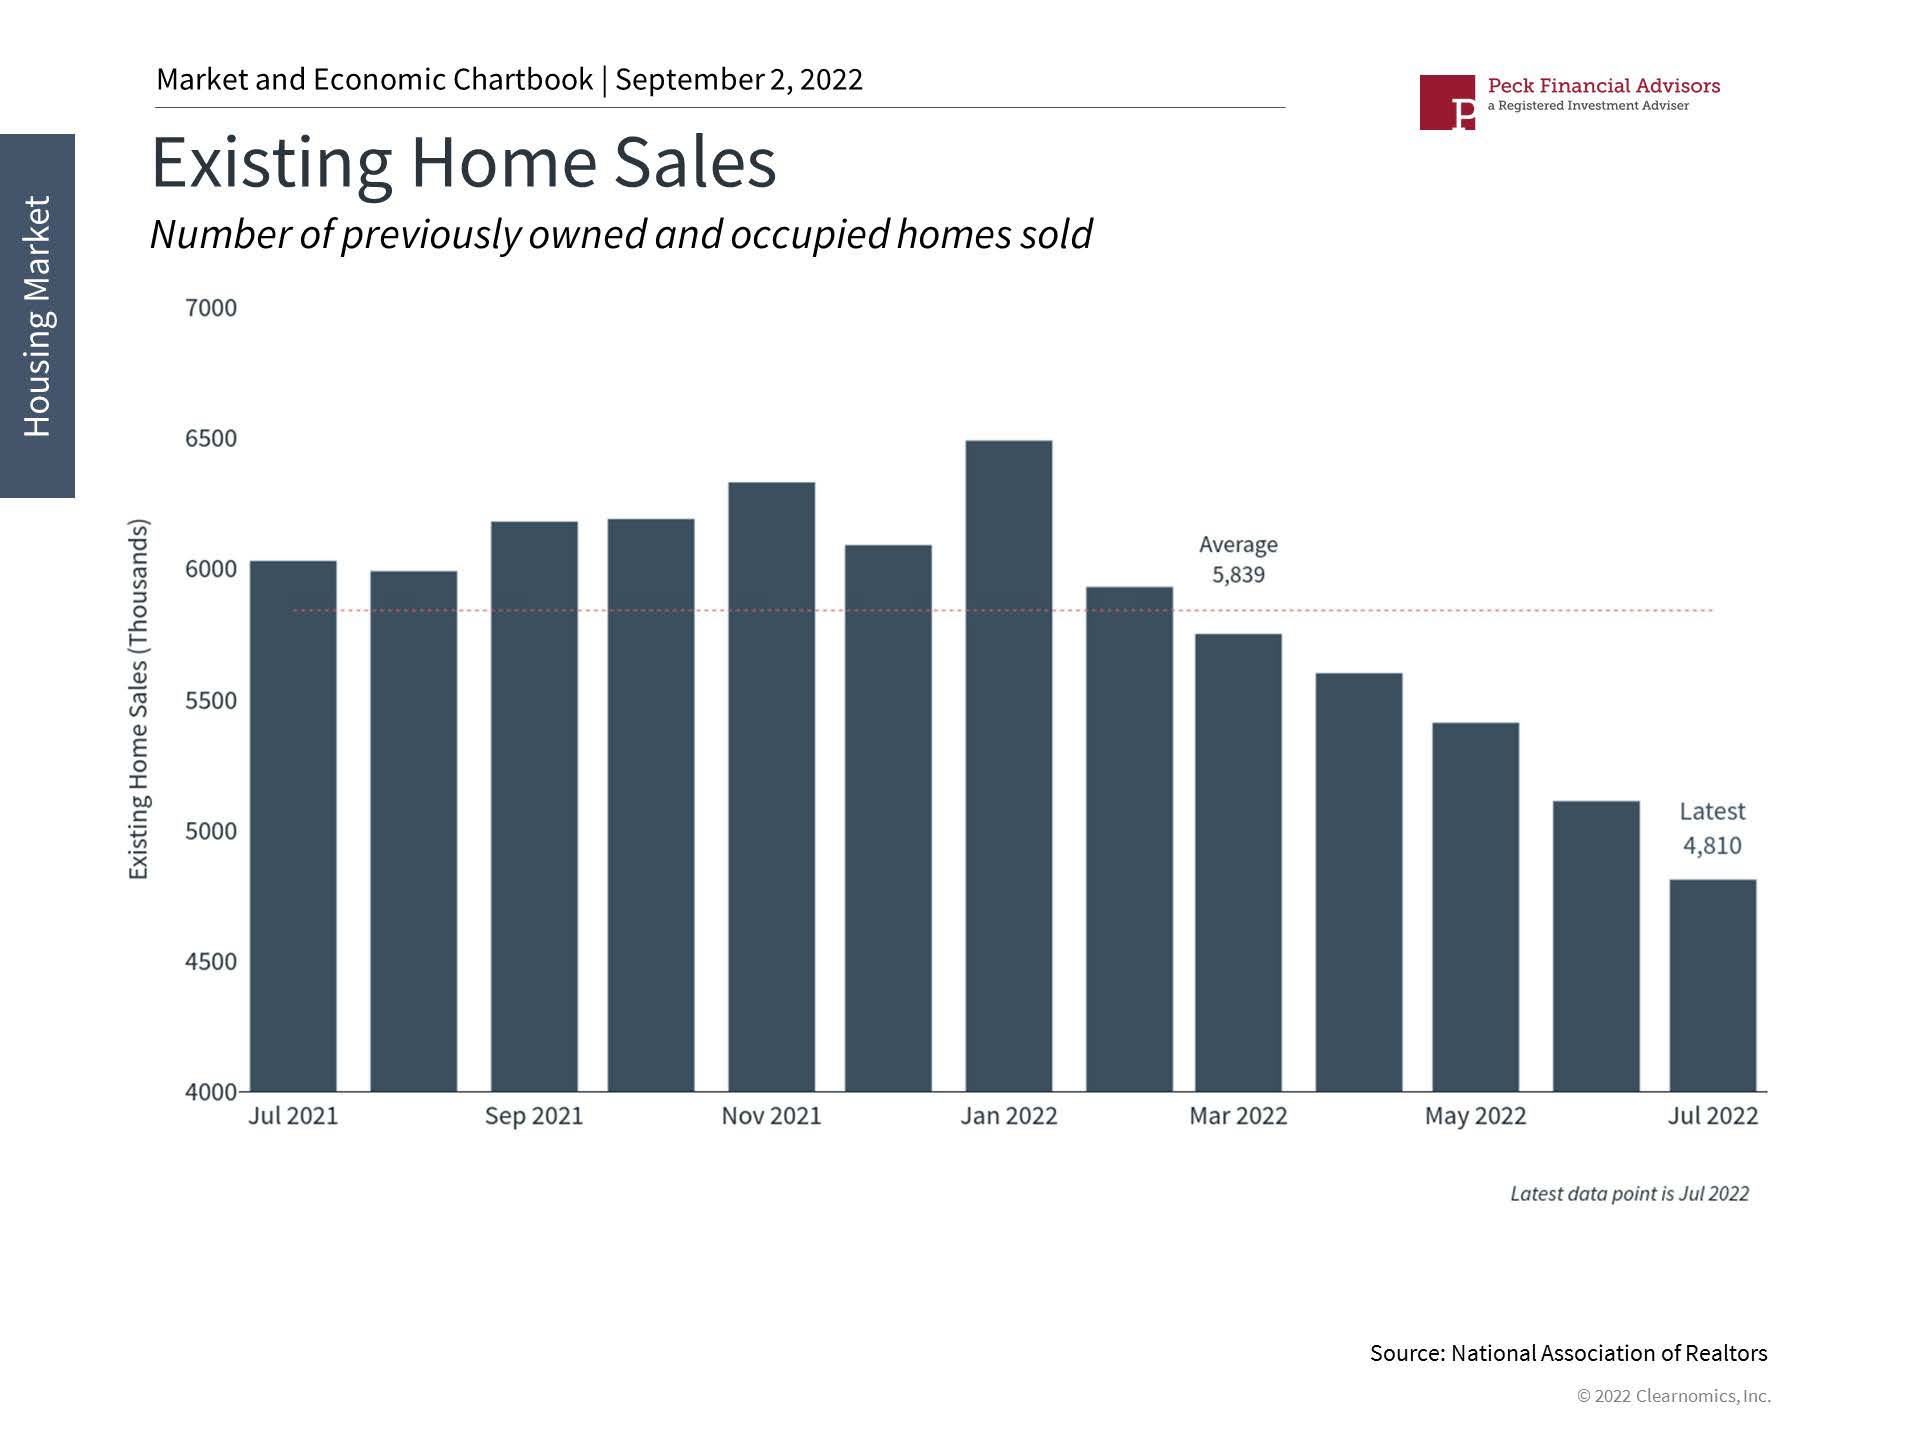
As it has all year long, interest rates that remain high or continue to rise could impact investors and consumers in many ways. Mortgage rates, for instance, are at their highest level since the global financial crisis, with the 30-year fixed averaging 5.5%. These higher borrowing costs have cooled the housing market. The number of housing starts, new building permits, and existing homes sold have declined. The number of months of new home inventory, which is the ratio of new homes for sale vs sold, has risen to 10.9, the highest since the Great Recession.
In this environment, investors ought to remain patient. Inflation will take time cool down which means that the fed funds rate will likely remain high through the first part of 2023. A slowing economy, after the rapid historic recovery over the previous two years, is natural and expected. The fact that the Fed needs to thread the needle between these two challenges increases the odds of market over- and under-reactions. As always, avoiding the urge to overreact, especially during temporary pullbacks and periods of rate volatility, is the key to staying on track to achieve long-term financial goals.
The bottom line? The market recovery has hit a snag as investors adjust to new Fed expectations. With the yield curve still inverted, long-term investors ought to stay patient as inflation eases and the economy enters a new phase of the cycle.